Janet Nichol, a Visiting Professor of Geography at the University of Sussex, has recently completed a research project ‘Remote Sensing of London’s Urban Heat Island, by day and night’ through the use of ERDAS ER Mapper. Specifically, this research could be used to aid health authorities explore spikes in inner city death rates associated with increasing summer temperatures, and to predict when city living can become high risk to particular demographic groups.
 The urban heat island effect is the increase in temperatures within urban areas in comparison to rural areas. Although difficult to measure and map spatially due to limited data availability from sparsely distributed weather stations, the use of Hexagon Geospatial technology allows sufficient intelligence to be gathered and analysed to create a spatially detailed map of the temperatures and temperature variations across London’s inner boroughs and residential districts during the 2019 heatwave.
Thermal satellite images can provide a dense grid of temperatures across a whole city, but only at relatively low spatial resolutions due to the weakness of the signal at thermal wavelengths. To compensate for the weak signal, thermal sensors are designed to sample larger ground areas to obtain a viable, measurable, at-satellite signal. Selecting a period of known high temperatures, thermal satellite images were sourced from Landsat and ASTER and processed using the emissivity modulation function, which corrects the data for differential emissivity of known surface types, while outputting a corrected surface temperature image with enhanced spatial resolution. In addition to the low-resolution, these data were problematic in that the Landsat satellite only covered London daytime at around 11am, and although some night-time data of London captured by the ASTER satellite does exist, none was available of the period evaluated in this project.
“THE EMISSIVITY MODULATION FUNCTION… CORRECTS THE DATA FOR DIFFERENTIAL EMMISSIVITY OF KNOWN SURFACE TYPES, WHILE OUTPUTTING A CORRECTED SURFACE TEMPERATURE IMAGE WITH ENHANCED SPATIAL RESOLUTION.”
JANET NICHOL, VISITING PROFESSOR OF GEOGRAPHY
Free data were downloaded from NASA’s EOSDIS Earthdata Hub, along with boundary files from London DATASTORE of the Greater London Authority, which was then uploaded into Hexagon’s ERDAS ER Mapper. This software was chosen due to its ease of use and excellent geometric correction and broad raster data processing capabilities. In particular due to its interactive image enhancement procedures using histogram manipulation, ER Mapper was the perfect solution, being the sole provider of this functionality within the image processing software market.
Image pre-processing involved using the subsetting function in the first instance, to extract the London study area. Image geometric correction then co-registered the Landsat and ASTER images to the correct coordinate system, meaning the local authority boundaries and street network could be overlaid seamlessly.
The Near-Infared (NIR) and red bands were used to derive a Normalised Difference Vegetation Index (NDVI) and atmospheric correction was also carried out. Additionally the Landsat thermal image waveband was recalibrated to display temperature in degrees Celsius. This process involved; Digital Number (DN) to radiance conversion, emissivity correction using Planck’s constant and then incorporating the NDVI image at 30m resolution into the emissivity correction equation, thereby to deriving land surface temperature at 30m pixel size.
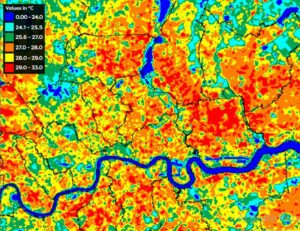
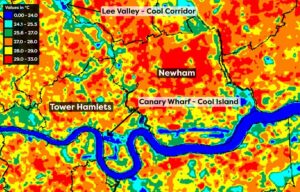 Through the use of ER Mapper, the research converted the DN values of the Landsat thermal image, with an original resolution of 100m, to Land Surface Temperature (LST) in degrees Celsius at 30m pixel size. The process was achieved by inputting both the thermal band and the derived NVDI dataset into the Planck equation, obtaining the emissivity corrected LST output at 30m pixel size. With the enhanced thermal image resolution created through this process, London’s urban heat island could be evaluated at street level from the Landsat data. Although these data only provided information for late morning over London, and urban heat islands develop most noticeably later in the day or at night, it was still concluded that initial patterns of warming could be seen across the city. Comparing the results to other studies, it is shown to be representative of the actual patterns of urban heat island development.