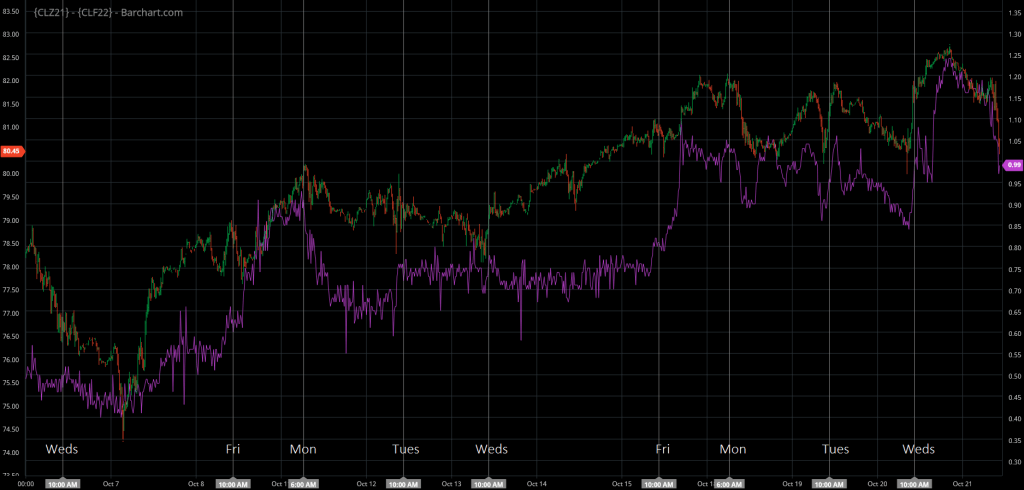
What probably does not help this process is the fact that out of the wider US market, stocks at Cushing – the delivery point for WTI futures contract – are by far the tightest. Geospatial Insight’s (GSI) final reading for the week ending Friday 15th, released Monday 18th, showed another massive draw of -2.4 mbbls at the storage hub, just 80,000 bbl wide of the official figure from the EIA released on Wednesday 20th. Arguably more interesting was the Cushing stock data which GSI measured on Thursday 14th and then released on Friday 15th at 10am Central time. This dataset included nearly all of the week’s stock changes and showed a draw-down pegged to Friday 8th of -2.694mbbl. Compare this with the official EIA figure released Wednesday 20th of -2.320mbbl and that may explain some of the bigger moves in the timespreads on recent Fridays. Looking at the chart below showing timespreads (purple) vs the January WTI contract (OHLC coloured bars), the 10am Central Time releases from GSI are marked for two recent Fridays, October 8th and 15th. Within three hours of these stock figures being released, the timespreads spiked some 35% on both days. Not only a leading indicator to the EIA data some 5 days ahead, but also to price action two-and-a-half hours ahead of these big moves.
The GSI data on intervening days continue to show heavy daily draws and that puts Cushing inventory at the lowest point since October 2018. What’s more, initial GSI measurements for this week, ending Friday 22nd October, are giving us an early indication that more strong draws are heading our way. This may explain the continued rise in timespreads, where prices remain volatile but are holding out above $1 per barrel.