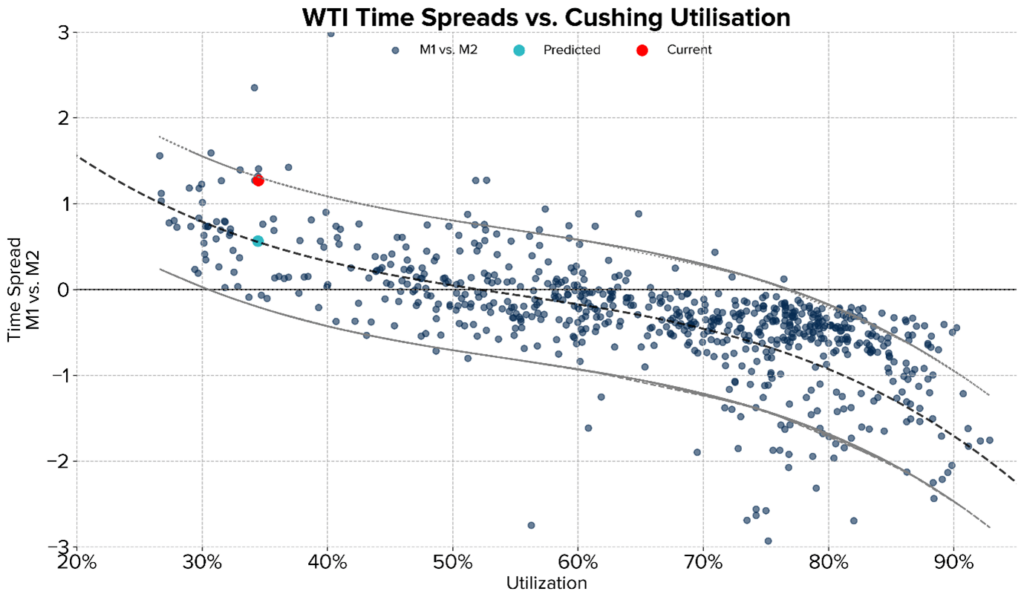
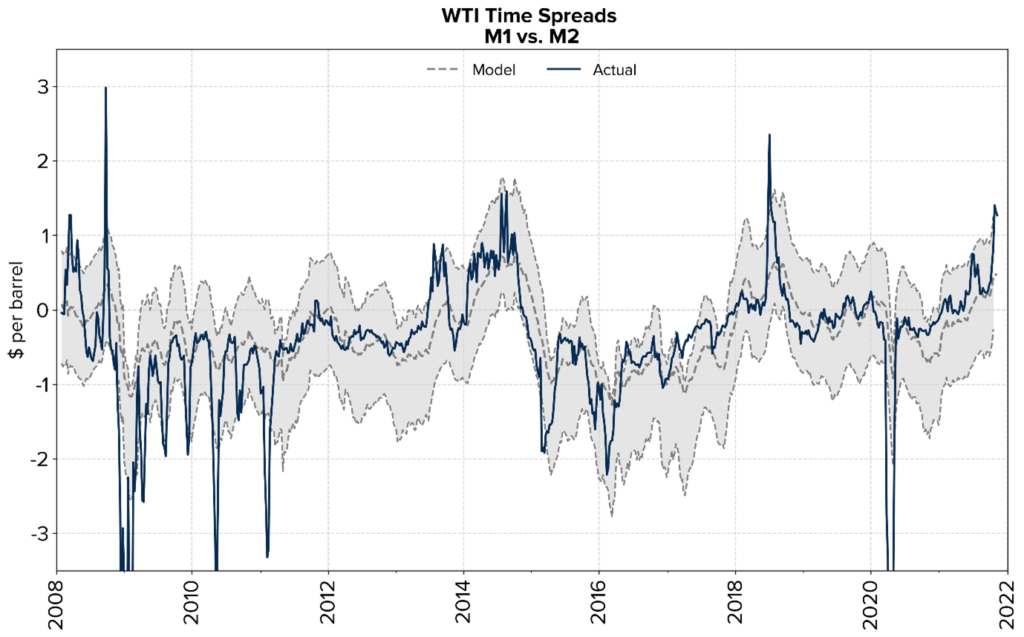
This price level was also in evidence a week earlier on Monday 1st November, as the market opened and prices remained at this extreme level for most of the day. Cushing utilisation is still at the low end of historical readings but, together with a strongly bullish narrative on the international oil market, timespreads remain somewhat on the high side of what OilX’s model would suggest, based on inventory alone (see graphs below).
Official EIA data released the following day on Wednesday 10th at 10:30am Eastern, showed a build in commercial nationwide stocks and a flat week for Cushing for the week ending Nov 5th, though partly thanks to a large release of SPR inventory. We continued to prove an unparalleled indicator of the official numbers at Cushing. It’s forecast for crude inventories at the hub, also measured Friday 5th, but released earlier on Monday 8th, were just 38 kbbl wide of the EIA.
Initial TankWatch readings for the current week do show some potential for a small Cushing build. One small build may do little to significantly cool extreme backwardation, however the rapid pace of declines experienced in late summer do look to be behind us for now. That is largely in line with our thinking from a few weeks’ back that the heavily dislocated nature of regional US stocks (very low at Cushing, but a reasonable cushion at the Gulf Coast) would prove to be constrained – and eventually reversed – by changes to relative pricing and pipe flows into and out of Cushing. WTI spreads between Cushing and the Gulf Coast and Atlantic markets have narrowed substantially over the last few week
It could be that we are also seeing the first impacts of new midstream developments in the US, namely expansions to pipeline capacity taking crude out of Western Canada and into the US Midwest – we note that PADD-2 crude imports rose last week to a good 500 kb/d above the September average, backed by recently very strong Canadian production. Using our TankWatch data to monitor daily in-flows and changes at the Canadian operators Cushing tanks’ remains a helpful indicator. This as well as higher production in the Gulf of Mexico – Shell has now restored production at Mars and Ursa – should help to limit the call on Cushing inventory to feed a step-up in PADD-3 refinery intake over the coming weeks. We may even soon see Cushing stocks begin a steady continuous recovery, and thus a significant softening in timespreads. As usual, our four data points per week represent a crucial bellwether in this regard. In particular, the Thursday Cushing measurement released Friday does include most of the stock movements for the week and so is the most important leading indicator to the official EIA figures.
And what of Strategic Petroleum Reserves releases? It remains possible that we see an extraordinary series of releases SPR with President Biden under increasing pressure to cool domestic gasoline prices. SPR may not be a particularly effective means of achieving this, however, in terms of inventories at the WTI delivery point, releases at the Gulf Coast would limit even further the marginal draw on PADD-2. Now is a good time monitor Cushing stock levels, at the highest available frequency, with potentially higher production in-flows, lower draw-downs to the coast and the approaching expiry of the December contract next week
This article was written in collaboration with Neil Crosby, OilX.
Neil Crosby has a decade of experience in oil and gas consulting and currently works a senior analyst at OilX. His work has focussed heavily on market analysis and price forecasting, in particular on the downstream oil sector.