

Home » WTI time spreads driven by high accuracy, high frequency Cushing Data
Cushing stocks already finished the week ending October 1st at approaching just 60% of the level observed during the same week last year, and some 85% vs the equivalent week in 2019. With that in mind, it has never been more important to have additional, timely information on the state of US crude inventories.
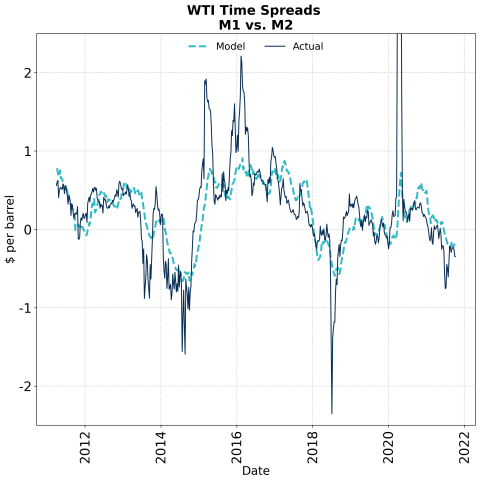
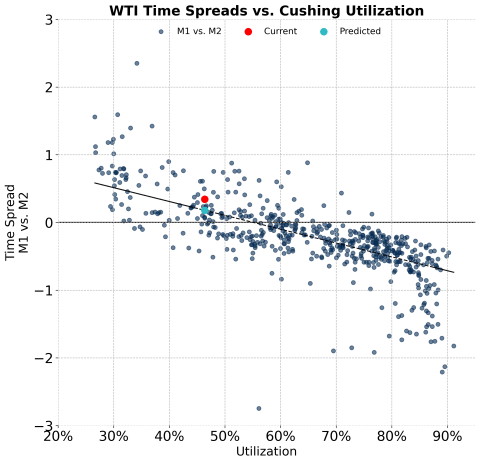
That partly substantiates the view currently playing out at the front of the WTI curve that the US will continue to be one of the epicentres of global crude tightness. In recent weeks, timespreads remained largely in line with OilX’s Fair Value model based on Cushing utilisation alone. However, the ongoing Energy Crunch and its repercussions for the oil market mean speculation is rising and further volatility in pricing is likely. What is more, in the US sphere we have already seen initial suggestions over potential government action to protect domestic crude availability. Watch this space to keep up with a fast-changing market.
In order to get an edge against their competitors, market participants combine statistical tools with higher-frequency and more accurate data. Geospatial Insight (GSI) TankWatch data provides Cushing readings 4 times per week, more than any other provider of Cushing inventory data. GSI is a pioneer in this front and have been using high accuracy aerial survey methods since January 2018, with readings every Monday, Tuesday, Thursday and Friday. This approach enables GSI to provide a unique leading indicator for Cushing inventories.
For example, GSI’s Monday drone flight reveals the major Cushing inventory changes one day ahead of the Tuesday figures published by other firms. Furthermore, Thursday and Friday flights enable an unparalleled high-accuracy estimate of the EIA data (released the following Wednesday)
TankWatch Cushing data has an exceptionally high correlation to EIA’s weekly ending stocks and in particular weekly changes. These facts mean GSI is quickly becoming the new benchmark market data for Cushing. For the week ending October 8th, midweek readings from GSI, released Tuesday 5th and Wednesday 6th, pointed to another healthy draw. The drawdown was confirmed when the precise Friday 1st to Friday 8th October stock data was released yesterday by GSI at noon UK time. Just as this TankWatch Cushing reading was released, front month WTI timespreads leapt more than 30% to over $1 in a matter of minutes. After this initial spike, prices did however settle back to the recent range of 75-80¢, around 35 minutes later.
TankWatch Cushing Application – Week 39
WTI timespreads jump over 30% yesterday.
As the November contract (CLX21) approaches expiry next week on the 20th October, now could be just the right time to take a look at high frequency Cushing crude. It may just give the necessary clarity for one of the many variables, currently impacting this part of the energy market.
This article was written in collaboration with Neil Crosby, OilX.
Neil Crosby has a decade of experience in oil and gas consulting and currently works a senior analyst at OilX. His work has focussed heavily on market analysis and price forecasting, in particular on the downstream oil sector.

Browse our latest news and insights
Learn more about the experts behind the insights
Get in touch with our team today